Network analysis is all about looking at the patterns of relationships we find in our data, and seeing how individual ‘nodes’ are positioned vis-a-vis all the other ones, or what the emergent, macroscopic patterns might imply about how the entire population of …whatever it is you’re studying… might experience things like group identity or flows of information.
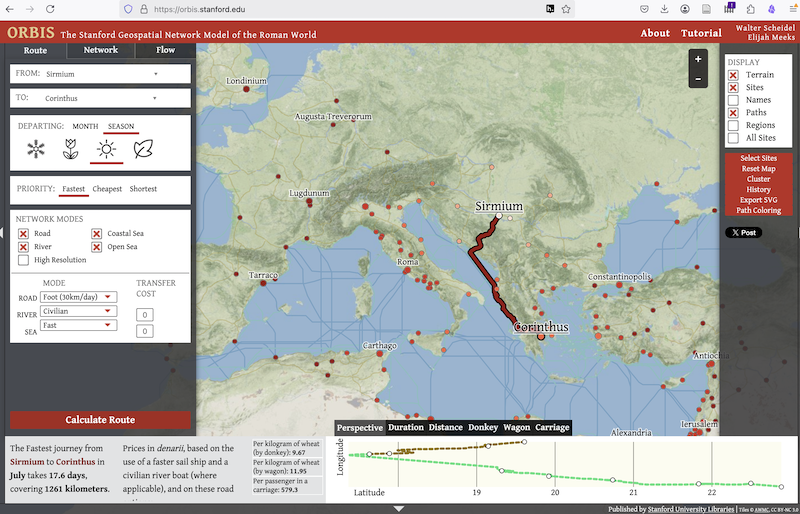
We’re going to look at the entire Roman road network as represented in the ORBIS geospatial network model of the Roman world: https://orbis.stanford.edu/.
ORBIS is a multimodal, seasonally variable transportation network model available at orbis.stanford.edu. The model provides for practically unlimited permutations by allowing users to limit modes, change movement cost, and adjust time of year. However, it is as a more simple network that ORBIS can be usefully integrated into other research, such as historical environmental reconstruction or agent-based modeling set in the Roman world. (Scheidel, Weiland and Arcenas 2014)
Go and play with that website for a moment. You’ll see that there is a lot of data tied to those nodes - the individual cities - and the route (road, river, sea) links between them. Using various network statistics underneath the interface, the site is able to give you a sense of some of the lived experience of the Roman empire. But perhaps we’d like to know things like, are there any ‘subgraphs’ in this network? Sometimes we call a network a ‘graph’, and so a subgraph is an area within a graph that has structural properties such that it stands out. A network of high school friendships might have subgraphs that represent different friend groups or cliques. With the Roman data, maybe subgraphs carry echos of earlier ethnographic divisions of space. Maybe there are key nodes in the graph, cities that because of their positioning vis-a-vis other cities were in a position to control the flow of information - and maybe that maps onto economic power. A network perspective can be quite illuminating!
With that in mind, this view of the ORBIS network is provided as a simple node and edge list. Nodes are sites and include X and Y coordinates for geographic positioning. Edges have source and target (but no geometry) as well as distance in KM, cost in denarii per kilogram of grain delivered by wagon, and duration of travel in days of each route segment either based on calculated time (for sea routes), fixed speed (for rivers) or 30km/day speed (for roads). The type of the route is also included. (Scheidel, Weiland and Arcenas 2014)
In our workbench, open the week 6 folder and go to the roman-networks.ipynb file. That notebook will show you how to obtain the ORBIS data representing the Roman world and how to do some basic analyses. There is also another computational notebook that shows how to do the same analysis using the R programming language. You might prefer the aesthetics of one approach over another. Finally, there is an opportunity to try those techniques out on some data from a fictional historical 19th century Ontario graveyard.
For fun, there is also an visualize-pkm.ipynb file that will read in your workbench’s pattern of wikilinks and perform some network analysis and visualization on your own notes. Which notes are most central? Which notes would lie on the most paths between any two pair of notes? What ideas would therefore surface for a person who was casually clicking through your notebook? What does that tell you about your experience of digital archaeology so far?