Introduction
In this tutorial, I show you how to build a web map using open source code from Leaflet. The idea here is that you learn to build a map and get it online: and then you learn how to modify it to display:
- the cemetery that you have worked on
- the location of stones
Leaflet is very powerful; we’re not even scraping the surface with what it can do. As an example, the East End Cemetery website maps a historic African American burial ground in Henrico County and the city of Richmond, Virginia, that uses Leaflet to good effect:
With time and practice, you would be able to build something similar. Remember, I am not expecting perfection; rather, I want you to push yourself until you get stuck.
Start small, and push yourself as far as you can go:
- Can I get a basic base layer displayed, centred on the graveyard? If so, then:
- Can I get some points (or even a polygon) displayed on that map? (Hint - check the ipynb file in the labbench on quick maps with geojson.) If so, then:
- Can I find another map layer that meaningfully adds context?
…now go!
Simple dots-on-a-map with GeoJson
The geojson format is a text file that lists coordinates and any other metadata about the coordinates as pairs of ‘keys’ and ‘values’.
If you followed my installation instructions properly, you have already configured your lab bench (JupyterLab Desktop) with a plugin that recognizes the geojson format and instead of showing you the text will show you a map of the data instead.
Here’s a neat trick that your lab bench will do for you automatically. The short version of this workflow would be: Create a new file; paste the raw geojson data into it; save and then rename the file your-file-name.geojson. Double-click on that file: your lab bench is smart enough to recognize the extenstion and that it’s dealing with geographic data and it will automatically render a map! To see this in action, go to quick-map-with-geojson.ipynb computational note in the week three folder in your lab workbench and work through it. Nice as geojson is (and there are websites that can take a table of point data and turn it into geojson, see the end of this document) we sometimes want something a bit more complicated, allowing a bit of user interaction.
Webmapping with Leaflet
The following is a modified exercise from the Open Digital Archaeology Textbook Environment by Graham et al 2019; this particular section was contributed by Neha Gupta of UBC.
First of all, a webmap is not a Geographic Information System or GIS. A webmap may be derived from a GIS, but the key difference is that a GIS allows analytical questions to be asked of, and derived from, different layers of spatial or spatialized data. Webmaps are used more for conveying the results of such analyses, for telling the story.
Tiled map service and Web Map Service are two forms of Web-based mapping. A WMS is an interface that enables us (the clients) to request specific maps i.e. visual representations of geographic information from a geospatial database. The WMS server is called via a Universal Resource Link (URL) on an Internet-enabled desktop GIS. A request typically consists of the geographic layer (e.g. theme) and geographic area of interest. The response to a request results in geo-registered map images that are displayed and queried within a browser. Because the map is dynamically drawn upon request, and because the server typically uses the most current information from several layers in the geospatial database, WMS maps tend to load slowly.
Tile map services such as TileMill Project, OpenStreetMap, and Stamen all use one or more vector layers that have been rasterized into an image. (A ‘raster’ is an image where the colour of each pixel has been specified; a ‘vector’ is where the geometry is described as points and lines. A raster gets blurry the more you zoom in; a vector is described mathematically and so remains sharp no matter the zoom). This rasterized image is divided into 256 x 256 adjacent pixel images or ‘tiles’. This is usually the base layer in a web map. Different slices of the map are tiled appropriately to allow for zooming.
Each tile is an image on the Web, which means that you can link to it. For example, the following URL points to a specific tile on the Web:
https://tile.openstreetmap.org/7/63/42.png
The three elements in the URL are:
- tile.openstreetmap.org, the tile server name;
- 7, the zoom level or z value of the tile; and finally
- 63/42, the x and y values in the grid where the tile lives
The z value has a range between 0 and 21, where 21 returns a tile with greatest detail (and smallest sized tile).
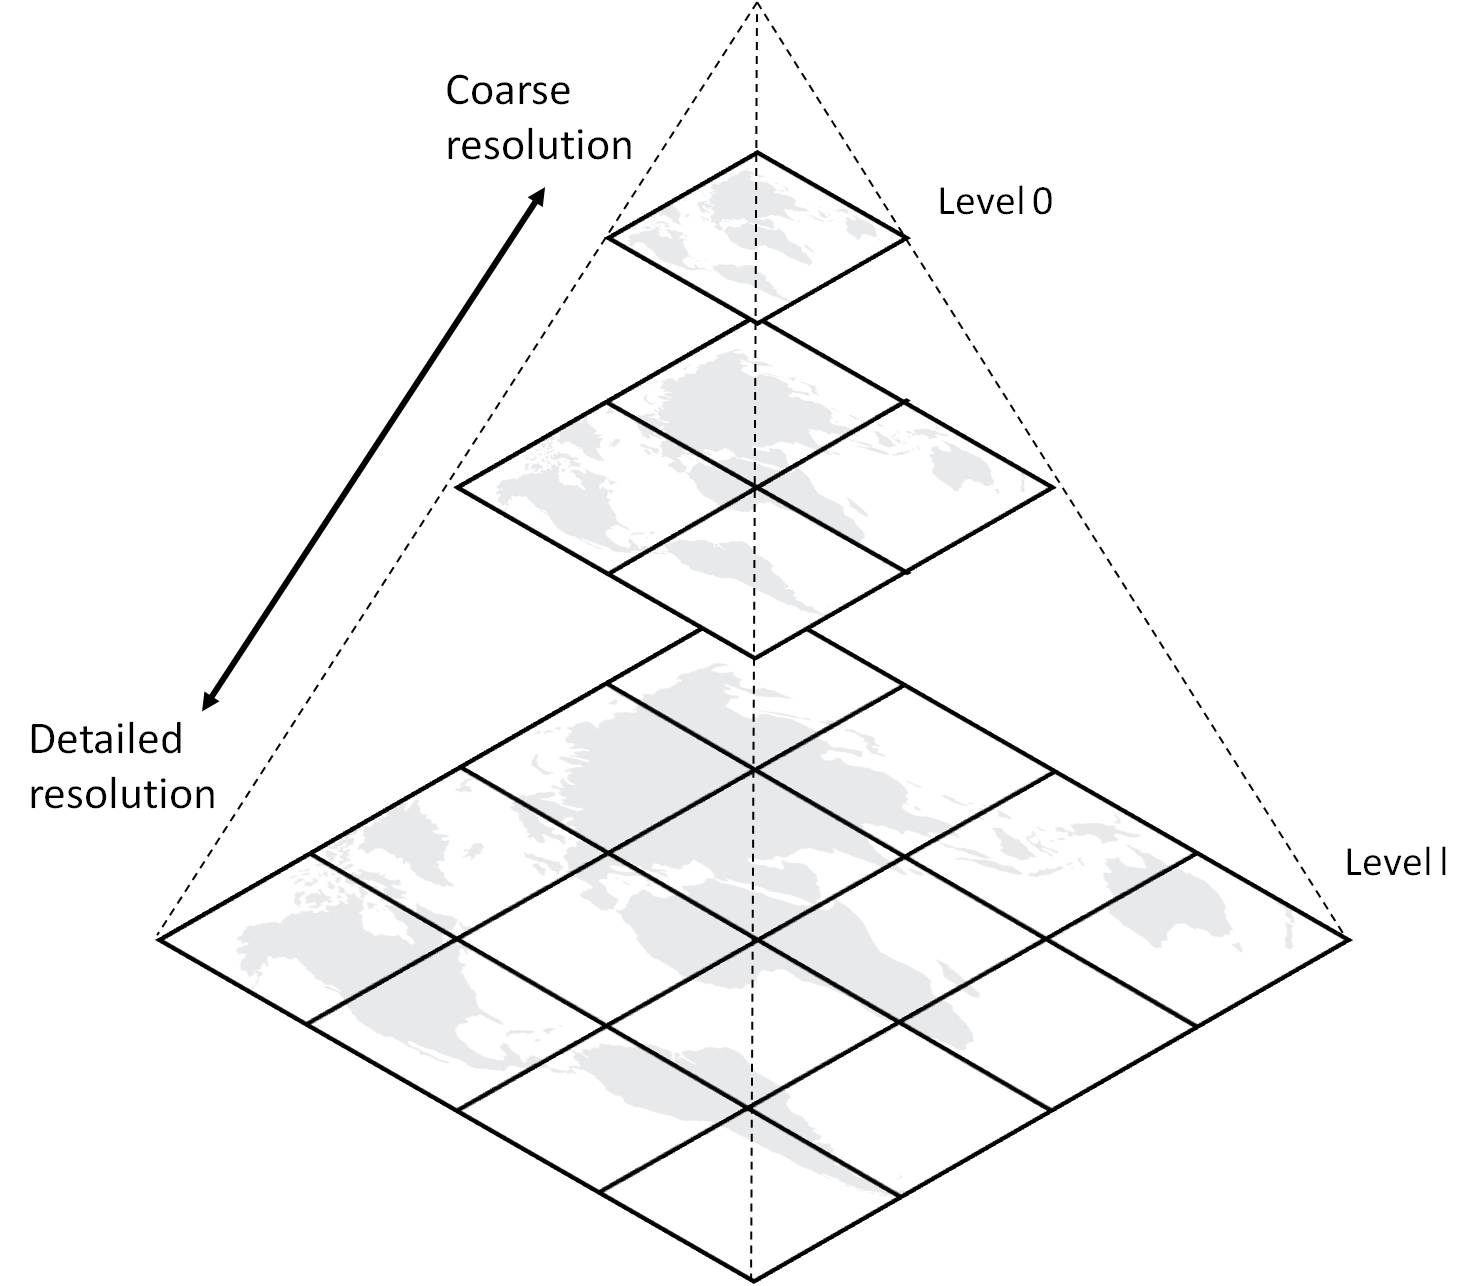
‘Image Tile Pyramid, https://www.azavea.com/blog/2018/08/06/generating-pyramided-tiles-from-a-geotiff-using-geotrellis/tilepyramid/’
Once generated, the set of tiles are stored on disk, ready to be distributed rapidly to large numbers of simultaneous requests. Tiled maps load quickly precisely because they are pre-generated. They shift attention to map aesthetics and smooth map navigation, trading in functionality such as layer order, map scale and projection. Alex Urquhart maintains a list of tile services.
Data layers are typically added on top of the base layer. Data layers can be points, lines and polygons. These data layers are saved as GeoJSON, a format designed for representing on the Web, geographic features with their non-spatial attributes.
Leaflet is a JavaScript library developed by Vladimir Agafonkin for use with tiled maps. Launched in 2008, Leaflet has become widely used in tile web mapping because the library’s low-barrier customization and interactivity with map elements, and because of its simplified setup when compared to a WMS served map. Moreover, Leaflet’s compatibility with other Web 2.0 technologies and code-sharing platforms such as GitHub has encouraged an active community of ‘makers’.
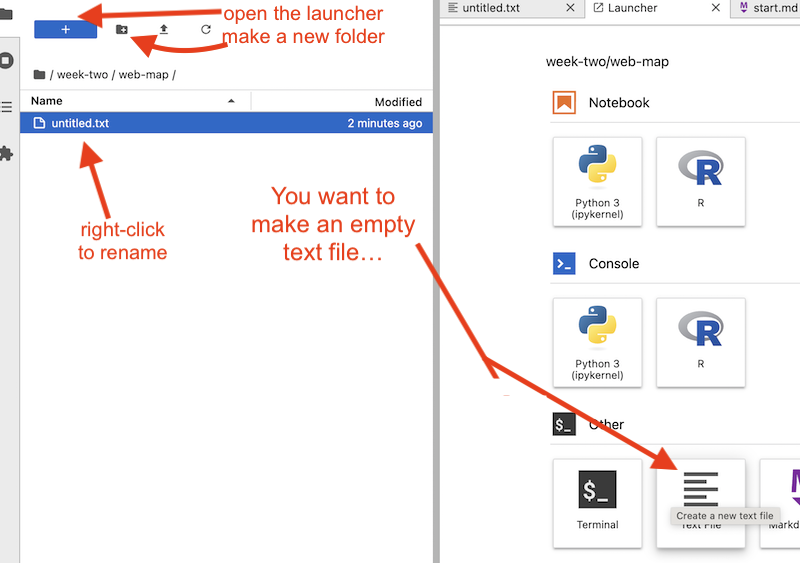
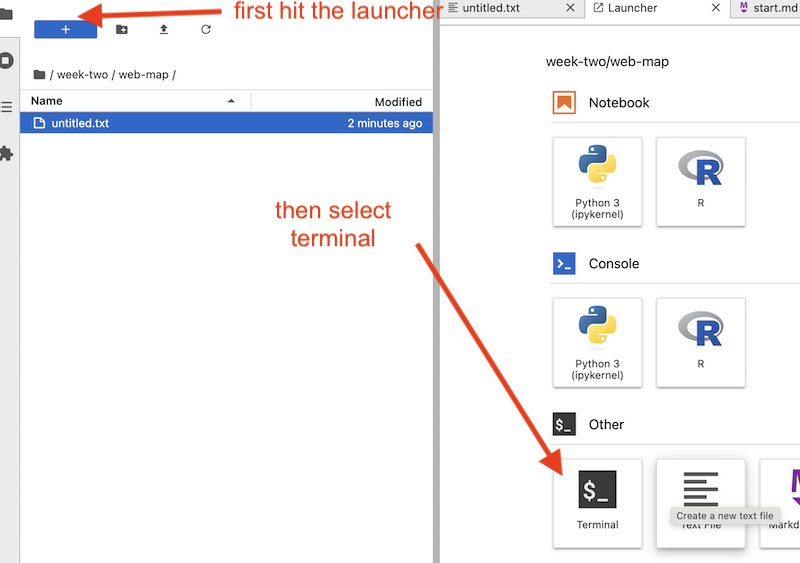
You will need a proper text editor (not notepad, not, shudder, Word) to edit your files. Our lab bench can handle that. If you open up your copy of Jupyterlab Desktop, under the ‘+’ symbol above the file-tray, you can create new folders and new text files.
-
While within your lab bench environment, create a new directory on your machine and call it ‘web-map’.
-
We’re going to build a map now; create a new file in that folder and rename it as
index.html.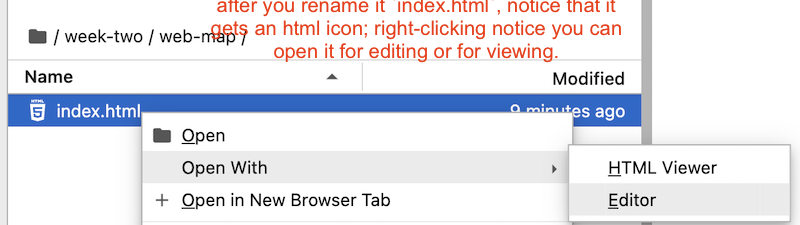
-
Now we start building the structure of our webmap. HTML - hypertext markup language - is a text file that uses tags like
<a>to tell a browser how to interpret the information between the opening and closing (</a>) tags. We’ll begin by putting some important information about the building blocks we’ll use to build our webmap in the ‘header’ of our html. These tell the browser where to find some of the more complicated information, like how to style our text, or what other scripts to load to use. This first bit of information will go between<head>and<\head>tags. Copy and paste the following into your index.html:
<head>
  <title>A Demo WebMap</title>
  <meta charset="utf-8" />
  <meta name="viewport" content="width=device-width, initial-scale=1.0">
  <link rel="stylesheet" href="https://unpkg.com/leaflet@1.9.4/dist/leaflet.css" />
  <script src="https://unpkg.com/leaflet@1.9.4/dist/leaflet.js"></script>
    <script src="https://ajax.googleapis.com/ajax/libs/jquery/1.11.1/jquery.min.js"></script>
</head>
This is telling the browser the name of this page, and it’s telling the browser where to get the stylesheet and the code for making the map work. The styling information and the map rendering logic from leaflet that will power our map comes via a deliver service called unpkg.com.
- The next bit of code defines the body of our webmap and tells the browser where to get the map and how to display it:
<body>
<div id="mapid" style="width: 600px; height: 400px;"></div>
<script type="text/javascript">
// Initialize the map (without adding a default tile layer)
var myMap = L.map('mapid').setView([45.4192857, -75.6973237], 13);
// Define layers
// Base layer from OpenStreetMap
var openStreetMapLayer = L.tileLayer('https://tile.openstreetmap.org/{z}/{x}/{y}.png', {
maxZoom: 18,
attribution: 'Maptiles © <a href="http://www.openstreetmap.org/copyright">OpenStreetMap</a>'
});
Notice that we haven’t closed the body tag yet. The line beginning with <div> is creating a box for us to put the map into (‘div’ means ‘division’ or section of an html document). You can see that we have defined its width and height in pixels. Then we have an open script tag telling the browser that we’re going to give it some javascript. Right? We have now nested some javascript inside the body of the html. The script defines a variable called myMap and uses leaflet.js code - L.map - to set the default latitude, longitude, and zoom level for the box mapid that will display myMap.
Phew. But we’re not done! Now we need to get a base layer for our map. The next variable we’re defining is called openStreetMapLayer and it does what it says - it uses L.tileLayer from leaflet.js to reach out to the openstreetmap tile server. It specifies the maximum zoom layer we’re going to allow, and it also permits us to put the attribution information, the copyright for the base map data as a bit of html between the single quotation marks.
- All we’ve done so far is create the infrastructure to hold our map, and some variables defining the map. Now we actually need to add them to the map. Add the following:
openStreetMapLayer.addTo(myMap);
This little bit of code starts with the map layer variable and then uses the leaflet function .addTo() to put your data into the myMap container.
- Let’s now close our open tags:
</script>
</body>
</html>
Your complete code will look like this (and notice how your editor colour-codes the tags and attributes so you can read/debug things):
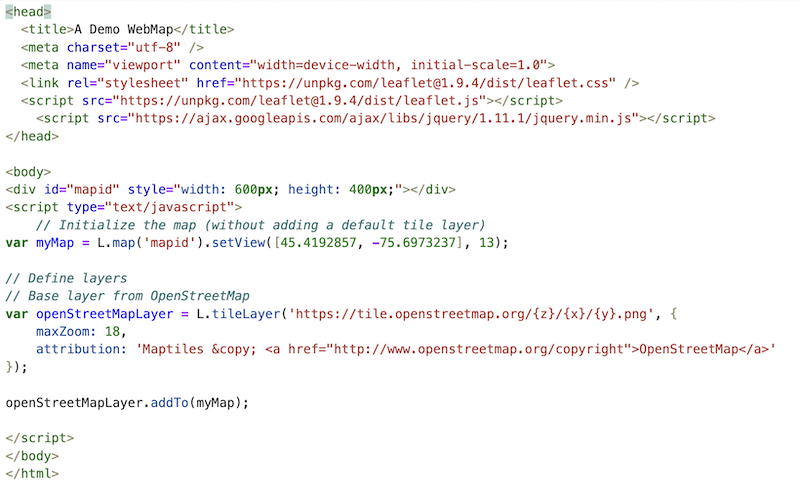
Hit ctrl+s to save your map. Then double-click on the filename; hit ’trust-html’. Ta da!
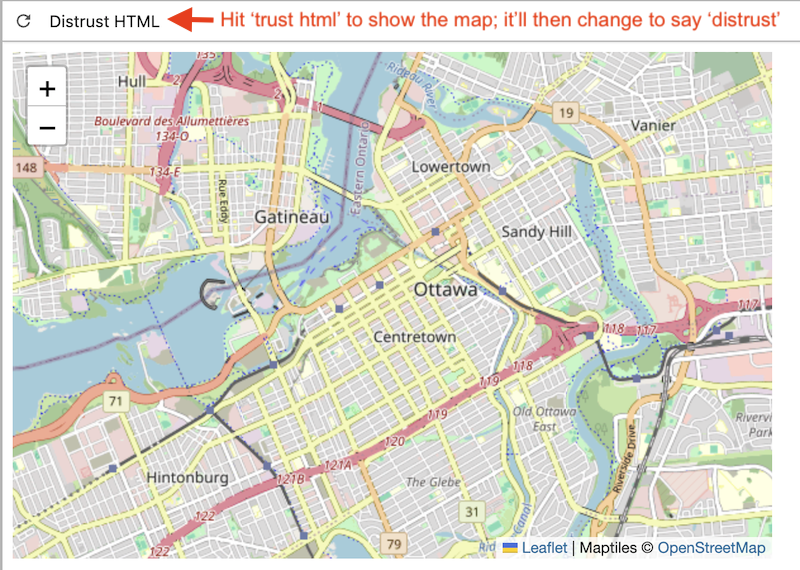
As maps go, though, that’s a bit boring. But it is a web map that you built from start to finish.
Adding some custom data points.
- We’re going to need some data for our map. Our point data will be encoded in a format called ‘geojson’, which is a kind of list that uses ‘key’ and ‘value’ pairs to describe the geometry of geographic information. (If you have geographic data in a csv table, with latitude and longitude columns, you could use this tool to convert it to geojson; another useful tool is geojson.io that will let you also draw boundaries and areas then represent as lines.) For now, the geojson that we will use has two points in it:
{
   "type": "FeatureCollection",
   "features": [
  {
    "type": "Feature",
    "geometry": {
       "type": "Point",
       "coordinates":  [-75.6973237, 45.4192857]
    },
    "properties": {
    "Label":"Centre of our map!"
    }
  },
  {
    "type": "Feature",
    "geometry": {
       "type": "Point",
       "coordinates":  [ -75.699222, 45.4275 ]
    },
    "properties": {
    "Label":"Not the centre of the map "
    }
  }
]
}
There are two ways we can add this information into the map. The first way just adds it directly into our html, which is what we’re going to do. The second way is to load the data from a file. This is often more elegant, especially when we’re dealing with lots of data. I will show you both ways.
Embedding the data Directly
Here, we’re going to create a variable called geojsonData and then we’ll create a variable called dataLayer. The dataLayer variable will use the leaflet L.geoJson function to read the data, format it, and add it to the map. Paste this after openStreetMapLayer.addTo(myMap); and before </script>:
var geojsonData = {
   "type": "FeatureCollection",
   "features": [
  {
    "type": "Feature",
    "geometry": {
       "type": "Point",
       "coordinates":  [-75.6973237, 45.4192857]
    },
    "properties": {
    "Label":"Centre of our map!"
    }
  },
  {
    "type": "Feature",
    "geometry": {
       "type": "Point",
       "coordinates":  [ -75.699222, 45.4275 ]
    },
    "properties": {
    "Label":"Not the centre of the map "
    }
  }
]
};

var dataLayer = L.geoJson(geojsonData, {
  onEachFeature: function(feature, featureLayer) {
    featureLayer.bindPopup(feature.properties.Label);
  }
}).addTo(myMap);
Ctrl+S to save your file, and then in the rendered view hit the reload button (beside where it says ‘distrust html’) and you’ll now see your data added! (And it automatically is configured to use OpenStreetMap base layer).
Push yourself: When you try to build a map of your graveyard, do you see how you could add your own point data with the csv-to-geojson tool?
Loading the data from a file
First of all, we need a data file! Grab the json data from the section above, where it’s just the clean json (and not the json inside a variable):
{
   "type": "FeatureCollection",
   "features": [
  {
    "type": "Feature",
    "geometry": {
       "type": "Point",
       "coordinates":  [-75.6973237, 45.4192857]
    },
    "properties": {
    "Label":"Centre of our map!"
    }
  },
  {
    "type": "Feature",
    "geometry": {
       "type": "Point",
       "coordinates":  [ -75.699222, 45.4275 ]
    },
    "properties": {
    "Label":"Not the centre of the map "
    }
  }
]
}
Make a new text file in your webmap folder, paste the data in, and then save it as point-data.geojson. Make sure you have it save with the right file extension - if you see something like point-data.geojson.txt you need to rename it to delete the .txt.
Go back into your html file, and type // in front of each line from var geojsonData to }).addTo(myMap);. This ‘comments-out’ those lines so that the browser will ignore them. We’re going to add a snippet of code to get your webmap to load the data from an external file.
- Append the following to your html, before the
</script>tag, which will tell leaflet where the data is and how to add it to our map:
// load a GeoJSON from external file
$.getJSON("point-data.geojson", function(data) {
  // add GeoJSON layer to the map once the file is loaded
  var datalayer = L.geoJson(data ,{
  onEachFeature: function(feature, featureLayer) {
  featureLayer.bindPopup(feature.properties.Label);
  }
}).addTo(myMap);
});
Save!
- Hit the + button above the file tray to bring up the launcher. Click on the ’terminal’ option. This opens up a place where you can give commands directly to your computer.
- Click in there, and type this:
python -m http.server 8001:
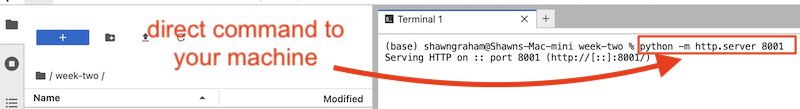
- The terminal will tell you now that your server is running at an address that will look something like this:
Serving HTTP on :: port 8001 (http://[::]:8001/) ...That means that your regular ol’ webbrowser is listening for websites from the local computer (yours!) on channel 8001. So in the url of your browser type:http://localhost:8001/.
Congratulations! You have made a webmap! Do you see how you could recenter the map on Ottawa? Add some more data? Change the base map to another style? Also - because you put your html file inside a folder but gave the file the name index.html your browser understands that if the URL you gave it is to a folder (ie, ‘webmap’) it should automatically look for an index.html file and load that up.
Video Walk Throughs
Forgive the production values.
…and then:
Serving your webmap online
We’ll get deeper into the weeds about how to make your webmap available to the world later in the course, but for now, if you want, you can go to https://app.netlify.com/drop and drag-and-drop your webmap folder onto the ‘drop’ button. Netlify will make a temporary spot on the internet for you from that folder because it contains the file index.html. When it’s finished, it will tell you the link to your website. If you want, you can then sign up for a free account so you can continue to host your materials online.
(You can also do this via Github. First upload your web-map folder to Github by dragging the folder onto a repository. Then, to make Github serve your website, you go into the settings -> pages, select ‘deploy from a branch’, then save. So if I loaded it into github.com/shawngraham/demo/webmap in the gh-pages branch, my map will be available at shawngraham.github.io/demo/webmap/index.html. Cool, eh?)
Adding a new layer to our map
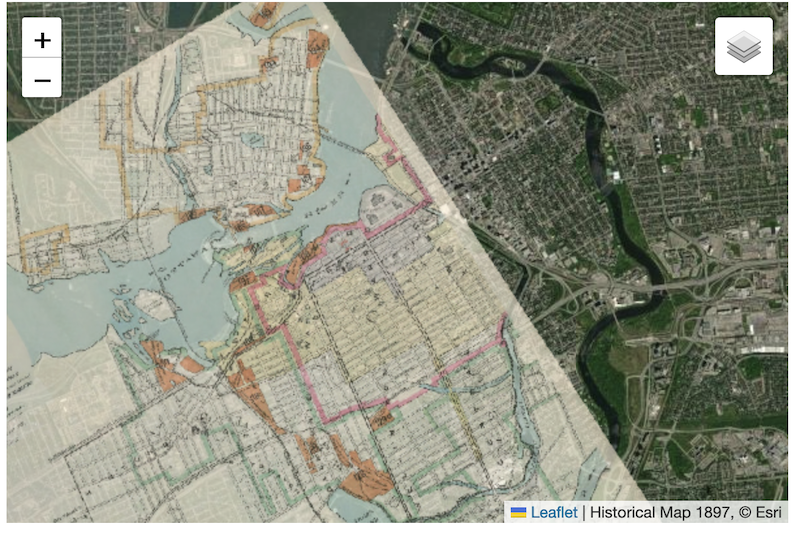
Map Warper is a service that allows us to upload images of maps, and then tie ‘control points’ to real-world geography such that we stretch and warp the image to overlay the physical world. It then provides us with a tile-server so that the image can be imported into our map as its own layer. Take a look at this map of Ottawa:
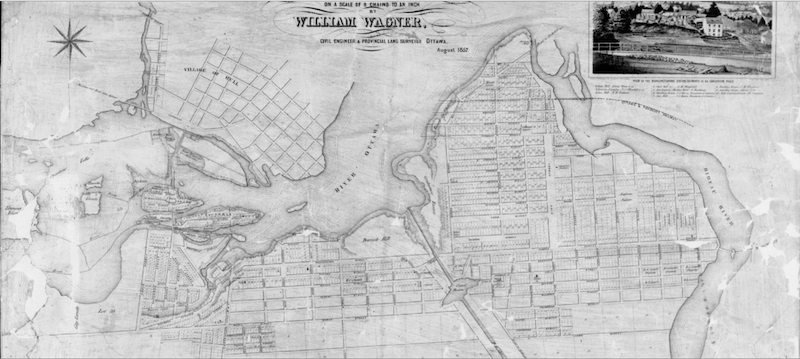
This was uploaded to Mapwarper and georectified by a former MA student at Carleton. You can see it on Mapwarper at this location.
If you click on the ‘Export’ tab, you’ll find that there’s a URL for the map as tiles: http://mapwarper.net/maps/tile/61034/{z}/{x}/{y}.png.
That’s the line we want to add to our map.
- Open your
index.htmlfile. - We’re going to add another layer, just after where you first specified your basemap, which to remind you, was at:
// Define layers
// Base layer from OpenStreetMap
var openStreetMapLayer = L.tileLayer('https://tile.openstreetmap.org/{z}/{x}/{y}.png', {
maxZoom: 18,
attribution: 'Maptiles © <a href="http://www.openstreetmap.org/copyright">OpenStreetMap</a>'
});
Hit ’enter’ a few times after that final semicolon, and then paste in this:
var historicalLayer = L.tileLayer('http://mapwarper.net/maps/tile/61034/{z}/{x}/{y}.png', {
    maxZoom: 18
});
Then, do you see where we added the openStreetMapLayer to the map? Given that example, how would you add historicalLayer? Give it a whirl.
Save the file, and then double-click the file name so that your workbench reloads it for viewing (or hit the refresh button if it’s still open in another tab.)
Georectifying a base map
As archaeologists, we are often interested to show some process taking place in the past, so historical maps can be rhetorically extremely useful as base maps. But, to get such a map into a digital format that we can use, we need to georectify it.
Georectifying is the process of taking an image (whether it is of a historical map, chart, airphoto, or whatever) and manipulating its geometry so that it matches a geographic projection. Think of it like this: you take your handdrawn map, and use pushpins to pin down known locations on your map to a globe. As you pin, your image stretches and warps. Traditionally, this has not been an easy thing to do, if you are new to GIS. In recent years, the curve has flattened significantly. In this exercise, we’ll grab an image, upload it to the Map Warper website, and then export it as a tileset which can be used in other mapping programs.
At Library and Archives Canada I found an “Insurance Plan of Ottawa, June 1878” MIKAN 3824226. (nb Once upon a time when I first came across that map, those were the links that worked, but they no longer do; LAC does not use sensible permalinks to its collection which is enormously frustrating and makes it hard to do digital work.)
Here’s a search for fire insurance maps that should probably stay working for a while, if you want to start with that. Notice there’s an option for ‘online’ - these are things that have been digitized. Click on that. Then, you’ll see results and thumbnails. Pick one that’s interesting. When it loads up, there is a ‘download’ button for item. Click that, select ‘file’ (you want one image, not all the images as pdf) and then you’ll have a file you can try to georectify.
-
Go to Map Warper and sign up for an account. Then login.
-
Go to the upload screen:

-
Fill in as much of the metadata as you can - it’s important to credit the material correctly! Then select your map from your computer, and upload it.
-
On the next page, click ‘Rectify’.

-
Pan and zoom both maps until you’re sure you’re looking at the same area in both. Double click in a map, select the location icon, and click on a point (location) you are sure you can match in the other window showing the base map.
-
Click on the other map window, select the location icon, and then click on the same point.
-
Note the ‘Add control point’ button below and between both maps will light up. Click on this to confirm that this is a control point you want. Do this at least three times; the more times you can do it, the better the map warp.
-
Having selected your control points, click on ‘Warp image’.
-
You can now click on the ‘Export’ panel, and get the URL for your georectified image in a few different formats. Copy the tiles based URL and put that URL into your
index.htmlfile as you did in the previous section.
Adding a layer control button
You can see that with leaflet it is pretty easy to add more layers and more data to your map. But soon things get a little bit unwieldy. We’re going to re-organize our map so that we can turn layers on and off.
The end result will look like this:
In your wep-map folder, create a new text file and then rename it index2.html
- The header will remain the same:
<!DOCTYPE html>
<head>
  <title>A Demo WebMap</title>
  <meta charset="utf-8" />
  <meta name="viewport" content="width=device-width, initial-scale=1.0">
  <link rel="stylesheet" href="https://unpkg.com/leaflet@1.9.4/dist/leaflet.css" />
  <script src="https://unpkg.com/leaflet@1.9.4/dist/leaflet.js"></script>
  <script src="https://ajax.googleapis.com/ajax/libs/jquery/1.11.1/jquery.min.js"></script>
</head>
- Then the
<body>tag will start the same, creating the division our map will show up in:
<body>
<div id="mapid" style="width: 600px; height: 400px;"></div>
<script type="text/javascript">
- Now we create variables for each layer we want in the map:
// Define tile layers
var openStreetMapLayer = L.tileLayer('https://tile.openstreetmap.org/{z}/{x}/{y}.png', {
    attribution: '© OpenStreetMap contributors'
  }),

satellite = L.tileLayer('https://server.arcgisonline.com/ArcGIS/rest/services/World_Imagery/MapServer/tile/{z}/{y}/{x}', {
        maxZoom: 18,
        attribution: '© Esri'
}),

 historical1912 = L.tileLayer('https://mapwarper.net/maps/tile/65528/{z}/{x}/{y}.png', {
    attribution: '1912',
    opacity: 0.7
  }),
  historical1854 = L.tileLayer('https://mapwarper.net/maps/tile/61034/{z}/{x}/{y}.png', {
    attribution: '1854',
    opacity: 0.7
  });
Noice that we’re pulling in data from three sources: Open Street Map, Esri, and Map Warper. Notice that each layer has an attribution property; notice also that the attributions for the two historical maps are … less than optimal! You can go to https://mapwarper.net/maps/66528 and mapwarper.net/maps/61034 and see if you can find better information to put in the attribtuion.
Now we’re going to create two more variables to group our layers into base maps and overlay maps:
// Define layer groups
var baseMaps = {
  "OpenStreetMap": openStreetMapLayer,
  "Satellite": satellite
  };

var overlayMaps = {
  "1912": historical1912,
  "1854": historical1854
};
Next, we create a variable called myMap to tell Leaflet the centre of our map, the zoom layer, and the default base map; we pass this information to the html container ‘mapid’ so that our creation can be displayed:
// Initialize map with default layer
var myMap = L.map('mapid', {
  center: [45.4192857, -75.6973237],
  zoom: 13,
  layers: [openStreetMapLayer] // Start with OpenStreetMap as default
});
and finally, we add a control box so that we can switch the different layers on and off, and that our layers are grouped appropriately, and we close the open script, body, and html tag.:
// Add layer control
L.control.layers(baseMaps, overlayMaps).addTo(myMap);
</script>
</body>
</html>
Ctrl+S to save your file! Double click on it or refresh the view if it’s already open in a tab in your workbench (or, if you left the terminal open and running, it should be also visible in your browser at https://localhost:8001/index2.html).
For more on layers with leaflet, see Layer Groups and Layers Control.
Now… a webmap for the graveyard you’re studying
Now that you’ve seen how to build a map and serve it online, let’s modify it to show the graveyard you worked on.
- You’ll want the map to be centred on the graveyard you worked on, so you need to figure out the coordinates for it. These will go in the code for the variable
myMap, and are in decimal degrees. If you can find your site on Google Maps, double-click on your graveyard and the latitude and logitude will show up in your browser’s address bar, eghttps://www.google.com/maps/@45.3844046,-75.6960548,428m/ - Coordinates for your stones go in the geojson file. Easiest way to do this might be to make a csv table like so, in a new text file (change the name of the file so that the file extension ends in .csv):
latitude,longitude,geometry,Label
45.4192857,-75.6973237,Point,Centre of our map!
45.4275,-75.699222,Point,Not the centre of the map
and then use this tool to convert it to geojson.
- You can try to find a historical map for an underlay, but only if you’re feeling keen; this might require you to georectify things.